Hazard Vulnerability Assessment
Hurricanes:
General information index. Also
see current hazard mitigation
measures.
Alexander County, Hiddenite,
Stony Point and Taylorsville have all experienced the inland effects of
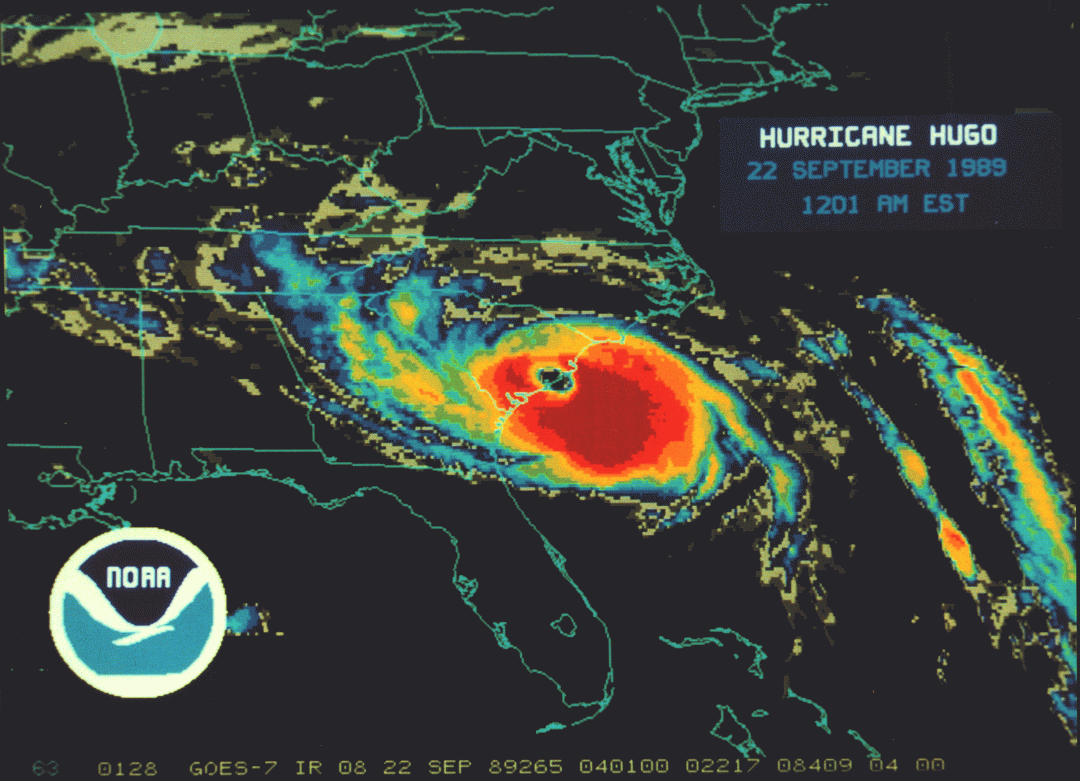
hurricanes. Perhaps the most memorable hurricane to directly effect the area was
Hurricane Hugo in 1989. Other storms however have had other impacts ranging from
flooding to "spin-off"
tornados,
storm surge,
high winds and tropical storms and
depressions. Generally these storms effect the entire population. Past effects
have been direct devastation to homes and business as well as public buildings
and utilities. Hurricane Hugo resulted in structural and non-structural (i.e.
power distribution system) damages over $8 million dollars.


Although no deaths have been recorded
in Alexander County as a direct cause of a hurricane, most deaths that occur from
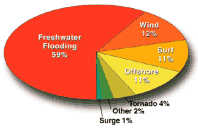
hurricanes occur from inland flooding.
Freshwater floods accounted
for more than half (59%) of U.S. hurricane deaths over the past 30 years. These
floods are why 63% of U.S. hurricane deaths during that period occurred in
inland counties.
This vulnerability assessment assumes
worst case,
Category 5 hurricane that travels the entire length or width of the county:
Table H1
** Potential Economic Impact from
an F5 tornado, Cat 5 hurricane, or catastrophic wind event
| Structural Damage |
$56,330,000 |
| Non - structural (i.e.
power distribution systems, etc.) |
$179,470,000 |
| Contents |
$74,670,000 |
| Lost inventory |
$3,930,000 |
| Relocation losses (cost
of relocating population) |
$57,640,000 |
| Capital losses |
$26,200,000 |
| Wages lost |
$31,440,000 |
| Retail income losses |
$22,270,000 |
| Total Potential
Losses |
$451,192,000 |
The potential for debris generation is provide
below as information for planners, solid waste professionals and county
executives as a planning tool for the need for possible landfill space. Debris
management following a major wind event is a costly and time consuming portion
of disaster recovery. Costs are associated with debris and efforts to reduce the
amount of debris that would be stored in a landfill may become a mitigation
measure for the future.
Table H2
*** Potential Debris generated from an
F5 tornado, Cat 5 hurricane or catastrophic wind event
| TOTAL CUBIC YARDS |
435,831 |
| Total Acres needed to
bury |
45 |
| Storage acres needed |
27 |
| Processing acres needed |
18 |
| Woody Debris (cubic
yards) |
130,749 |
| Construction and
demolition debris (cubic yards) |
305,082 |
| Burnable debris (cubic
yards) |
128,134 |
| Soil debris (cubic
yards) |
15,254 |
| Metals (cubic yards) -
possible recycle |
45,762 |
| Landfilled debris
(cubic yards) |
115,931 |
| Minimum cubic yards
potential (+/- 30%) |
305,082 |
| Maximum cubic yards
potential (+/- 30%) |
566,580 |
Source - NC Department of Commerce Economic Development
Information System
** HAZUS Information Data base - FEMA - Dunn and Bradstreet 1994. Adjusted to
2002 by 31%. Worst case scenario.
*** Debris management program mathematical formulas - FEMA- NCDEM- GCEM- 1999

